
♞ Trading using the Bollinger Bands
Bollinger Bands is a very popular technical analysis tool for trading binary options. A trading strategy based on Bollinger Bands is well suited for trading High/Low Options.
What are the Bollinger Bands?
Bollinger Bands is a tool created by John Bollinger in the ’80s. Bollinger Bands and their related indicators can be used to compare current market conditions with those of the past. In other words, they measure the ‘highness’ or ‘lowness’ of an asset’s price relative to past closings. Using Bollinger Bands, binary options traders can identify assets that have reached their short-term price limits and are expected to reverse direction to correct and absorb broader current price levels.
Bollinger Bands Formulation
The Bollinger Bands model includes three (3) curves.
◘ The Middle Band calculates a moving average of an asset over a period T.
◘ The Upper Band and the Lower Band are positioned at a specific distance above and below the Middle Band. This distance equals twice (x2) the standard deviation of the price for the period T.
Standard Settings of Bollinger Bands Tool
The standard setting for the period T of the Bollinger Bands is 20 periods. Traders may adjust the Bollinger Bands period to less or more than 20 periods based on the past behavior of each financial asset.
Chart: Bollinger Bands on EURUSD
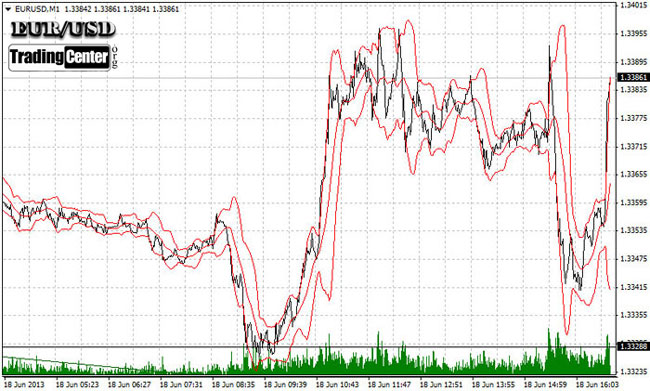
The above chart shows EURUSD on a 1-minute timeframe with Bollinger Bands set to 20 periods. Generally, EURUSD, like any other asset, tends to correct downward when it reaches the upper band. On the other hand, when EURUSD reaches the lower band, it tends to correct and move to higher levels.
Trading Binary Options using the Bollinger Bands
When trading binary options, if an asset reaches the lower Bollinger Band, you can buy a Call Option, and if it reaches the upper band, you may buy a Put Option. It is important to study the past behavior of the underlying asset before drawing any conclusions about the effectiveness of Bollinger Bands.
Another key factor is understanding the asset’s price momentum and adjusting the period (T) accordingly based on its past price behavior. Crucial support and resistance levels should always be carefully considered. If the asset price is approaching an important resistance or support level, it is better to wait and observe before executing your trade.
□ Trading using the Bollinger Bands
TradingCenter.org News Blog
L MORE ON TECHNICAL ANALYSIS • COMPARE • TECHNICAL ANALYSIS • INDICATORS • CYCLICAL ANALYSIS • LEARNING
□ Forex Brokers Comparison
□ Expert Advisors (EAs)
□ Broker Reviews
□ Learning
» Technical Analysis Guide
» Trading Chart Patterns
» Naked Charts & Price Zones
» Forex Technical Analysis
» Fibonacci Primes Sequence
» Harmonic Price Patterns
» RSI Precision
» PriceMomentum Chart
» CVD Indicator
» Key Technical Indicators
» ΔMP and Σ(ΔMP) Indicators
» Wyckoff Method
» TD Sequential
» Hurst Nominal Cyclical Model
» Elliott Wave Principle
» Forex Pairs
» Trading Books
» Trading Tips
