 📖 The Complete Technical Analysis Guide
Technical analysis is a trading method that aims to forecast the future price movement of a financial-traded asset based on past market data such as price movement and volume.
1. Introduction to Technical Analysis
Technical analysts use charts, patterns, indicators, and oscillators to identify similarities in the current and past market activity that can suggest future price movements. Technical analysis can be applied to all financial classes and assets such as stocks, indices, Forex pairs, and commodities. Technical analysts focus on two major questions:
(i) What is the current price of a financial-traded asset
(ii) What is the history of price movements of this financial-traded asset
Technical analysis cannot predict the future, but it can help traders and investors evaluate the possibility that a certain trend will continue or reverse. Furthermore, and most importantly, technical analysis can help investors to identify the best possible time to enter/exit the market.
Technical analysis is a valuable tool for timing entry points in any financial market. These are the three general principles of technical analysis: {Press the Following Slider}
(i) Price action discounts everything
All known news and updates are instantly incorporated into the prices of financial assets. This is especially true for highly liquid and efficient markets, such as the Foreign exchange market and stock indices.
(ii) Price movements are not totally random
(iii) Price moves in trends
The prices of financial assets tend to follow the same direction for long periods of time. This occurs because fundamental news and economic events often move in a clearly positive or negative direction for extended periods. The macroeconomic circle generates long-term trends in the financial markets. 🔗 More: » Money Supply, Liquidity, and the Course of Global Financial Markets
(iv) History repeats itself
Financial assets tend to react exactly the same if the market conditions are exactly the same. This can be explained as human behavior tends to repeat itself. If humans trade the global markets, and human behavior repeats itself, then the behavior of financial markets should also repeat over time.
(v) There is no specific timeframe required when trading the market.
Technical analysis can be applied in multiple timeframes.

2. Popular Technical Analysis Indicators
Technical indicators are mathematical calculations based on price volatility and volume activity. These tools are used to identify or to confirm the price trend, but also to generate buy or sell signals.
⚙️ Commonly used Technical Analysis Indicators {Press the Following Slider}
1) MACD (Moving Average Convergence Divergence) 2) Relative Strength Index (RSI) 3) Moving Averages (MAs) 4) Bollinger Bands 5) Stochastic Oscillator 6) Accumulation / Distribution 7) Average Directional Index (ADX) 8) Correlation Coefficient 9) Chaikin Money Flow 10) Balance Volume -OBV 11) William %R 12) Volume-Weighted Average Price (VWAP)
🔗 Read More: » Key Technical Indicators with Formulas
3. Major Types of Charts
Charting is an essential tool for all technical analysts. There are four major types of Charts:
- (1) Line Chart | (2) Bar Chart | (3) Candlestick Chart | (4) Point and Figure Chart

👉 Price Gaps
A price gap occurs when the price of an asset opens at a higher price than it previously closed. Post and pre-market activity are not important for defining gaps. Gaps are usually the outcome of news realized.
🔗 Read More: » Major Types of Charts | » Trading Chart Patterns
4. Harmonic Chart Patterns
Harmonic trading is based on geometry and fractals. The core of this trading method uses the primary ratio and its derivatives (1.618, 0.618, etc.). Harmonic price patterns indicate potential trend retracements and can be used to confirm signals from other technical analysis tools.
There are a lot of different harmonic price patterns, including:
- ABCD Pattern
- Three-Drive Pattern
- Gartley 222 Pattern
- Harmonic Bat Pattern
- Harmonic Crab Pattern
🔗 Read More: » More on Harmonic Price Patterns
5. Elliott Wave Principle and the Stock Market
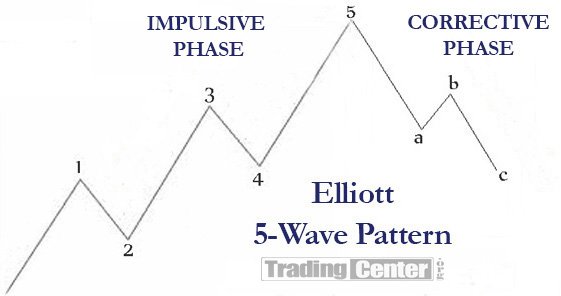 An American accountant, Ralph Nelson Elliott, studied price movements in the U.S. markets during the 1930s and suggested that certain price patterns tend to repeat over different periods. Elliott wave patterns consist of two phases: impulsive and corrective phases.
In this section, you will also learn about:
-A brief explanation of the Elliott Wave Principle
-The Correlation of the Wave Principle and the Fibonacci Sequence of Numbers
🔗 Read More: » Elliott Wave Principle
6. The Wyckoff Trading Method -Full Tutorial
Developed in the early 1930s by Richard Wyckoff, this method combines principles and chart patterns to identify market structure and forecast strong trends at an early stage. The Wyckoff Method can be applied to any financial market.
4️⃣ The Four (4) Phases of the Market Cycle
According to Wyckoff, the Composite Operator applies a predictable strategy that creates a repeating market cycle consisting of four phases:
-
Accumulation Phase (mark-up)
-
Uptrend Phase (consolidation)
-
Downtrend (mark-down)
-
Distribution Phase (consolidation)
👉 Note: The Composite Operator is a conceptual figure representing institutional investors and smart money that can significantly influence price movements.
Chart: Wyckoff’s Accumulation Schematics (EURUSD)
")
5️⃣ Wyckoff's Five-Step method
{Press the Following Slider}
According to Wyckoff, these are the five steps for reliable market analysis and efficient decision-making: (1) Analyze the trend and the dynamics of demand/supply by using volume bars. (2) Select assets in the same direction as the trend. Analyze how these assets have performed in the past during strong market trends (3) Select assets that are in an accumulation phase if you trade long, and in the distribution phase if you trade short. Determine if the potential reward of trading these assets is strong enough to justify the risk of holding them. (4) Evaluate the asset’s readiness to commence a trend using volume to confirm the completion of the accumulation/distribution phase. (5) Time your entries/exits in the market by using the general index
🔗 Read More: » Wyckoff Method Trading Tutorial
7. Trading Using the TD Sequential (Tom Demark)
The TD (Tom Demark) Sequential is a powerful tool designed to identify the exact time of trend exhaustion and price reversal. It is a counter-trend tool that aims to solve the problem of several TA indicators that are profitable during trending markets but perform very poorly in ranging markets. TD Sequential can be used on any timeframe and in any market condition, but it is more reliable on H4 charts and higher.
Chart: Applying the TD Sequential on EURUSD

📝 TD Sequential Key Features
(1) The TD Sequential can be used in any timeframe and any financial-traded asset
(2) It includes two phases: The setup phase (9-count) and the Countdown phase (13-count)
(3) The TD Sequential will work only in Japanese Candlesticks or Bar charts
(4) Timewise, the TD Sequential is ideal for the early recognition of key market turning points
(5) The TD Sequential also generates support and resistance levels (TDST lines)
(6) The rules of TD Sequential can be easily modified; therefore, there are many variations
🔗 Read More: » TD Sequential Tutorial
8. Pivots
A pivot point is a calculation based on the average of the previous period’s closing, high, and low prices. Trading above the pivot is considered bullish, while trading below it is considered bearish. Pivot points also act as support and resistance levels, with the most important being the Daily, Weekly, and Monthly pivots.
🧮 Calculating Pivots:
Pivot point (PP) = (High + Low + Close) / 3
- Support
First support (S1) = (2 x PP) – High
Second support (S2) = PP – (High – Low)
Third support (S3) = Low – 2 x (High – PP)
- Resistance
First resistance (R1) = (2 x PP) – Low
Second resistance (R2) = PP + (High – Low)
Third resistance (R3) = High + 2 x (PP – Low)
9. Fibonacci Sequence of Numbers
The Fibonacci numbers were introduced by the Italian mathematician Leonardo Fibonacci in the early 1200s. In this sequence, each number is the sum of the two preceding numbers. Additionally, any number in the sequence is about 1.618 times the previous number and 0.618 of the next number.
- Here are the first numbers of the sequence: 1,2,3,5,8,13,21,34,55,89,144,233,377,610,987, etc.
📉 Fibonacci Retracement
Fibonacci retracement is the most popular TA tool based on Fibonacci ratios. The Fibonacci retracement is a method for determining support and resistance levels and can be used when trading any financial market in any timeframe.
📈 Fibonacci Extensions Tool
While the Fibonacci Retracement shows potential levels of price retracement, the Fibonacci Extensions show how high the price can go following a retracement. Fibonacci Extensions are quite useful for spotting market tops when an asset is in a price-discovery territory.
Table: Key Fibonacci levels
|
📶 Key Fibonacci Levels |
|
|
0.2360 |
1.0000 |
|
0.3820 |
1.6180 |
|
0.5000 |
2.6180 |
|
0.6180 |
3.6180 |
|
0.7860 |
4.2360 |
📚 Book: » Guide to Fibonacci trading and Phi
🔗 Read More: » Learn more about Fibonacci Tools on TradingFibonacci.com | » Trading with Fibonacci Primes -The Platinum Sequence of Numbers
10. The Platinum Sequence of Numbers: Insights for Financial Trading
This analysis from Tradingcenter and Giorgos Protonoatrios highlights a valuable numerical sequence for trading global financial markets. The sequence combines Fibonacci numbers, prime numbers, and Fibonacci ratios.
The key to identifying this “platinum” sequence is the golden ratio (1.618) and its products, 2.618 and 6.854 (2.618 X 2.618). To create harmony, a few more Fibonacci numbers are added, seeking order and aiming for perfect balance.
Table: The Platinum Sequence (consisting of only Fibonacci numbers)
 and its products 2.62 and 6.85.")
🔗 Read More: » More on Trading with Fibonacci Primes -The Platinum Sequence of Numbers
💎 Trading Center’s Exclusive Technical Analysis Tools
TradingCenter is committed to providing the trading community with innovative technical analysis tools and techniques. The goal is to help traders analyze financial markets more effectively and understand the cyclical behavior of different asset classes.
11. RSI Precision: The Latest Technical Indicator from TradingCenter
Created by Giorgos Protonotarios, RSI PRECISION is an oscillator designed to enhance the traditional RSI by incorporating market momentum and price volatility, making it more accurate on longer timeframes. It identifies overbought and oversold levels and is suitable for analyzing any volatile financial asset. Like the standard RSI, RSI PRECISION can be used on any timeframe.
The oscillator has been extensively tested and optimized for all traded financial assets, but its settings can be customized to better match extreme market conditions.
📝 RSI Precision Features
The RSI PRECISION formula combines RSI readings with the periodic measurement of market momentum and price volatility. The key features are:
(1) Enhancing RSI and making it more accurate on longer timeframes, where RSI readings are hardly readable
(2) Identifying overbought/oversold market levels in a simple and user-friendly manner
(3) Making precise calculations near market tops and bottoms, where price volatility is always booming
(4) Offering the chance for experimentation by including a plethora of different settings
Example: RSI PRECISION vs CLASSIC RSI on Bitcoin (Monthly)

As shown in the chart above, RSI PRECISION provides a much more accurate view of price action compared to the classic RSI. The settings on the left include options such as adjusting the weight of the RSI calculation or the weight of market volatility.
⬇️ You can add RSI PRECISION here on TRADINGVIEW, for free: » https://www.tradingview.com/script/irWH8Wkm-RSI-PRECISION/
🔗 Read More: » Introducing RSI Precision (Enhanced RSI tool)

12. Introducing PriceMomentum – A New Chart Type
PriceMomentum is also created by G. Protonotarios and offers a new perspective to chart analysis. This chart type emphasizes percentage changes, rather than the price itself. In addition, it incorporates an algorithm that is designed to include market volatility and the shifts of the periodic momentum. It summarizes three main elements:
-Periodic Percentage change (%)
-Bullish/Bearish Periodic Momentum
-Volatility (as expressed by the daily range, from high to low)
📝 Basic Features:
- Focusing on percentage gains/losses by ignoring the price itself
- A PriceMomentum chart is closer to a logarithmic chart rather than a common price chart
- It combines price action with intraday momentum and volatility, and that makes it more precise than any other chart near market tops/bottoms
- It is sensitive to key shifts in the market momentum, especially if these shifts are characterized by significant volatility (something common near market tops/bottoms)
- Technical analysis formations and chart patterns are fully applicable to a PriceMomentum chart
- Moving averages are fully applicable too
Example: PriceMomentum on EURUSD

👉 Notes:
□ There is a perfect descending triangle that has formed throughout the past 18 years (2004-2021).
□ Each time the exchange rate touches the upper or the lower trendline of the channel, the trend is reversing emphatically.
🔗 Read More: » PriceMomentum Chart: A New Perspective to Chart Analysis
🎬 A 10-Step Guide to Building a Robust Technical Analysis Framework
These are key steps for building an effective Technical Analysis framework:
(1️⃣) Identify the master trend of the overall market in higher timeframes (Monthly, Weekly, Daily).
⛓️ Using tools such as Wyckoff phases, TD sequential, moving averages, higher-highs/lower-lows, etc.
(2️⃣) Identify financial assets that typically move in the same direction as the overall market.
⛓️ Analyze how these assets have performed in the past during strong market trends.
(3️⃣) Ensure that a fundamental basis supports your technical analysis thesis.
⛓️ Smart traders always incorporate a fundamental flavor into their technical analysis.
(4️⃣) Ensure that neither the market nor the assets you’ve chosen are in overbought territory.
⛓️ Use RSI Precision in higher timeframes (Monthly, Weekly, Daily) and confirm readings well below 80.
(5️⃣) Assess market sentiment to make sure you’re not following the herd -Always think contrarian.
⛓️ Using tools such as the Commitments of Traders Report (CFTC) report, Fear and Greed Index, etc.
⛓️ When there is retail fear, think about buying the market, and when there is greed, think about selling your positions.
(6️⃣) Evaluate the asset’s readiness to commence a trend using volume as confirmation.
⛓️ Always keep an eye on market volume and study Wyckoff’s Accumulation/Distribution.
⛓️ When price action and volume are found in perfect harmony, there is an already established price trend, and there is a high probability that this trend will continue (Wyckoff).
(7️⃣) Recognize chart patterns and candlestick formations (if any).
⛓️ These may include triangles, price channels, chart patterns, candlestick formations, harmonic patterns, etc.
⛓️ The rounding top and bottom are some of the most reliable reversal chart patterns.
⛓️ Some candlestick formations on higher timeframes (Monthly, Weekly) can signal an early-stage price reversal.
(8️⃣) Make sure you’re not trading a chart that shows a major price divergence.
⛓️ A divergence may occur between the slope of the price chart and the slope of MACD, RSI, Volume, etc.
⛓️ Divergences matter only in higher timeframes (Monthly, Weekly, Daily).
(9️⃣) Time your entries using specific trading setups and wait for the market to reach your setup.
⛓️ Look for confirmation on shorter timeframes, using tools like MACD or RSI Precision on the 1-hour chart.
(🔟) Combine technical analysis with seasonal statistics and market sentiment to optimize your trading decisions.
⛓️ Seasonal patterns can matter for certain assets. For example, April is typically very bullish for GBPUSD, and Crude Oil tends to be bullish at the start of each year.
🔗 More about seasonality: » Forex Pairs & Seasonality | » Crude Oil Trading | » Historical Price of Gold
👉 Note: No matter how effective your technical analysis or trading setups are, without proper money management, your long-term attempts to make money will be like building castles in the sand.
🔗 Reviews on Trading Center: » Forex Brokers Reviews
■ The Technical Analysis Guide
George Protonotarios for TradingCenter (c)
You are not allowed to publish, reproduce, translate, merge, sell, rent, or distribute any content on this website. You are also not allowed to create a derivative work or utilize framing techniques to enclose any content on this website.
L MORE ON TECHNICAL ANALYSIS • COMPARE • TECHNICAL ANALYSIS • INDICATORS • CYCLICAL ANALYSIS • LEARNING
□ Forex Brokers Comparison
□ Expert Advisors (EAs)
□ Broker Reviews
□ Learning
» Technical Analysis Guide
» Trading Chart Patterns
» Naked Charts & Price Zones
» Forex Technical Analysis
» Fibonacci Primes Sequence
» Harmonic Price Patterns
» RSI Precision
» PriceMomentum Chart
» CVD Indicator
» Key Technical Indicators
» ΔMP and Σ(ΔMP) Indicators
» Wyckoff Method
» TD Sequential
» Hurst Nominal Cyclical Model
» Elliott Wave Principle
» Forex Pairs
» Trading Books
» Trading Tips

