

The outcome of the American midterm elections left global markets with uncertainty, especially regarding the AI trade. Concerns are growing about how Democrats will handle their November victory. No doubt the AI trade needs more investment capital and new data centers to be built. However, many Democrats raise concerns about the environmental impact of building more and more data centers. Moreover, the fragile situation in the Middle East and higher upcoming interest rates add to the uncertainty.
On the other hand, US corporate earnings are strong in 2026. After the recent correction in market valuations, the earnings ratios are considerably improved compared to a few months ago. Furthermore, a financial crisis benefits no one, and many analysts believe that Democrats will finally make a deal with big tech, and the AI trade will eventually survive.
Technical Analysis on S&P 500 Weekly
This is the weekly chart for the S&P 500 along with some key support levels to monitor. The 7,000 level for the S&P 500 is absolutely crucial to what happens next for all equity markets. Today, the index is found at 7,400 points.
Chart: S&P 500 Weekly
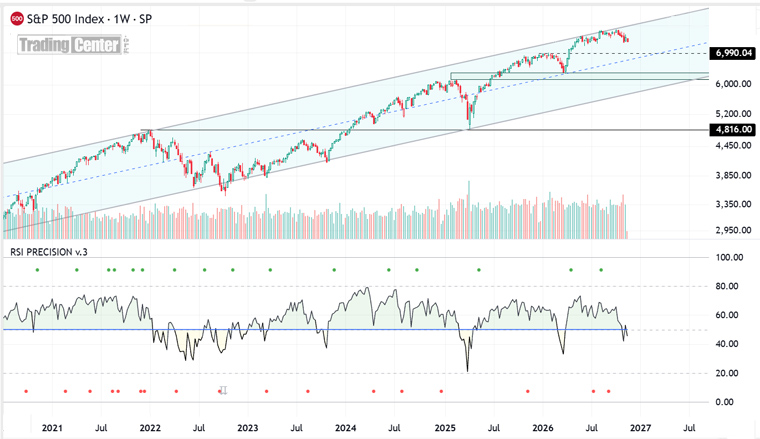
Let’s check some key demand/supply levels for S&P 500 and Nasdaq:

Key Support/Resistance Levels for S&P 500
(↓) Support:
- 7,230-7,330
- 7,000 (strong)
- 6,300-6,380 (strong)
- 6,150 (strong)
(↑) Resistance:
- 7,650
- 7,850 (strong)
Key Support/Resistance Levels for Nasdaq-100
Nasdaq has shown significant volatility after the American elections. Let’s assess some short-term levels of major support and resistance.
(↓) Support:
- 24,300 (weak)
- 23,900 (strong)
- 20,700-20,900 (strong)
- 20,100 (very strong)
- 18,000 (very strong)
(↑) Resistance:
- 25,800-26,100 (weak)
- 27,700 (strong)
Basic Fundamentals of the US Equity Markets
At the moment, the earnings of major companies in the US markets are improving. These are some personal estimates regarding P/Es, dividend yields, and P/S ratios for the three major US indices, plus Euronext and the German DAX. Assess these figures with caution, as the fragile economic environment may cause major shifts in future earnings estimates.
|
Index |
P/E (12-mo forward) |
Trailing P/E |
Dividend Yield |
P/Sales |
|
18.0 |
25.5 |
1.1% |
3.6 |
|
18.5 |
21.0 |
1.55% |
3.1 |
|
21.5 |
30.0 |
0.66% |
5.1 |
|
15.0 |
17.5 |
2.5%+ |
1.8 |
|
14.5 |
17.0 |
2.3% |
1.1 |
- Source: Personal assessment based on averaged data coming from Macrotrends, MarketWatch, and other sources
What Holds Equity Markets - Corporate Earnings Are Very Strong
Actually, 2026 is one of the best years for S&P 500 profit expansion since 2021. Based on Charles Schwab, let’s look at some sectors with exceptional EPS growth:
- Energy: +100%
- Information Technology: +60%
- Materials: +40%
- Industrials: +17%
- Financials: +16%
Things to Keep in Mind for the Rest of 2026 and Early 2027
- The Next FOMC meeting (December 8-9) - 73% odds in late October for a hike based on CME FedWatch
- The Treasury Curve - The 30-year yield of the US Treasury hit its highest level since 2007. Sharp moves higher could damage the valuations of all risk assets.
- The conflict in the Middle East and Energy Prices - The Iran conflict could push oil prices far above $100, and that would mean stickier inflation and more rate hikes
- The AI Trade and CAPEX - Goldman estimates that AI capex currently accounts for about half of S&P 500 earnings growth. Moreover, in 2027, investors will seek proof that AI spending can be turned into real revenue.
- Mega market-cap concentration. Goldman estimates that the top S&P 500 companies account for 39% of the whole S&P 500 market cap and about 31% of its earnings. That means if big tech found itself with problematic earnings, the whole index could face a strong downtrend.
■ S&P 500 and Nasdaq 100 Outlook for Late 2026 and Early 2027
Giorgos Protonotarios, Financial Analyst
TradingCenter.org (c) - November 17th, 2026
L MORE TUTORIALS • GENERAL GUIDES
□ Equity Trading
• FUNDAMENTAL ANALYSIS
» Money Supply & Liquidity
» Dow Theory & Strategy
» P/E, PEG, and Shiller P/E
» Warren Buffett’s Method
» Zweig Breadth Thrust Signal
» Benner’s Cycle
» Commitments of Traders Report
